the context.
Biotrop is a Brazilian agribusiness company specializing in biofertilizers, biostimulants and inoculants, with heavy investment in research for more sustainable agriculture.
the challenge.
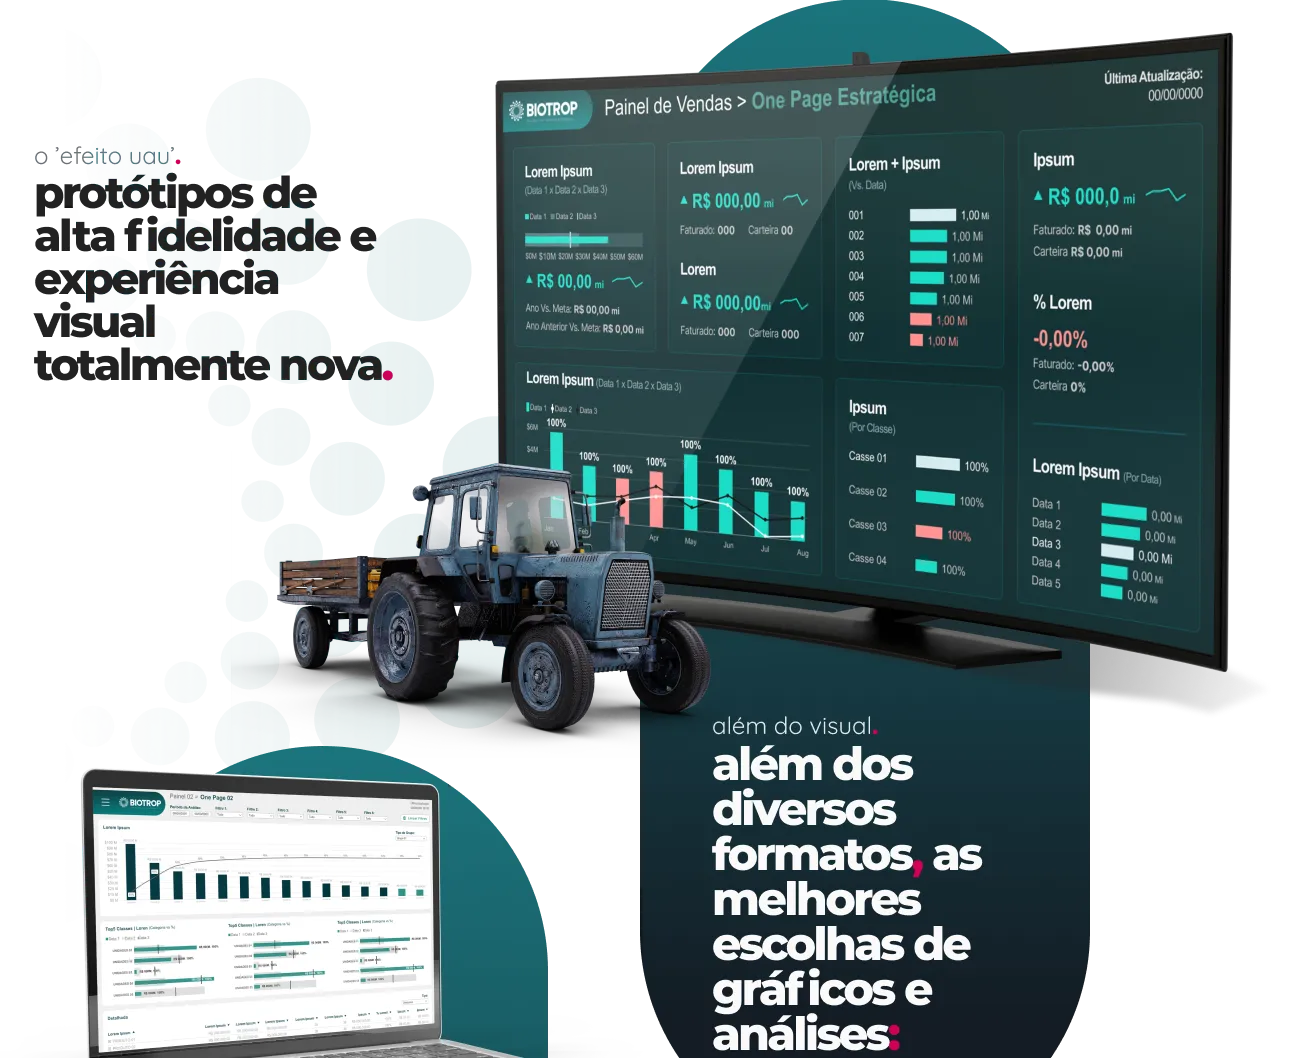
Managers and coordinators frequently exported data to Excel, a sign that the dashboards did not answer the questions of the people who decide. The panels had to be redesigned to be clearer and better organized, and the data team needed a way to scale that standard.
what we did.
- Brand study and a dedicated visual identity for the dashboards.
- Prototypes with a current, organized design.
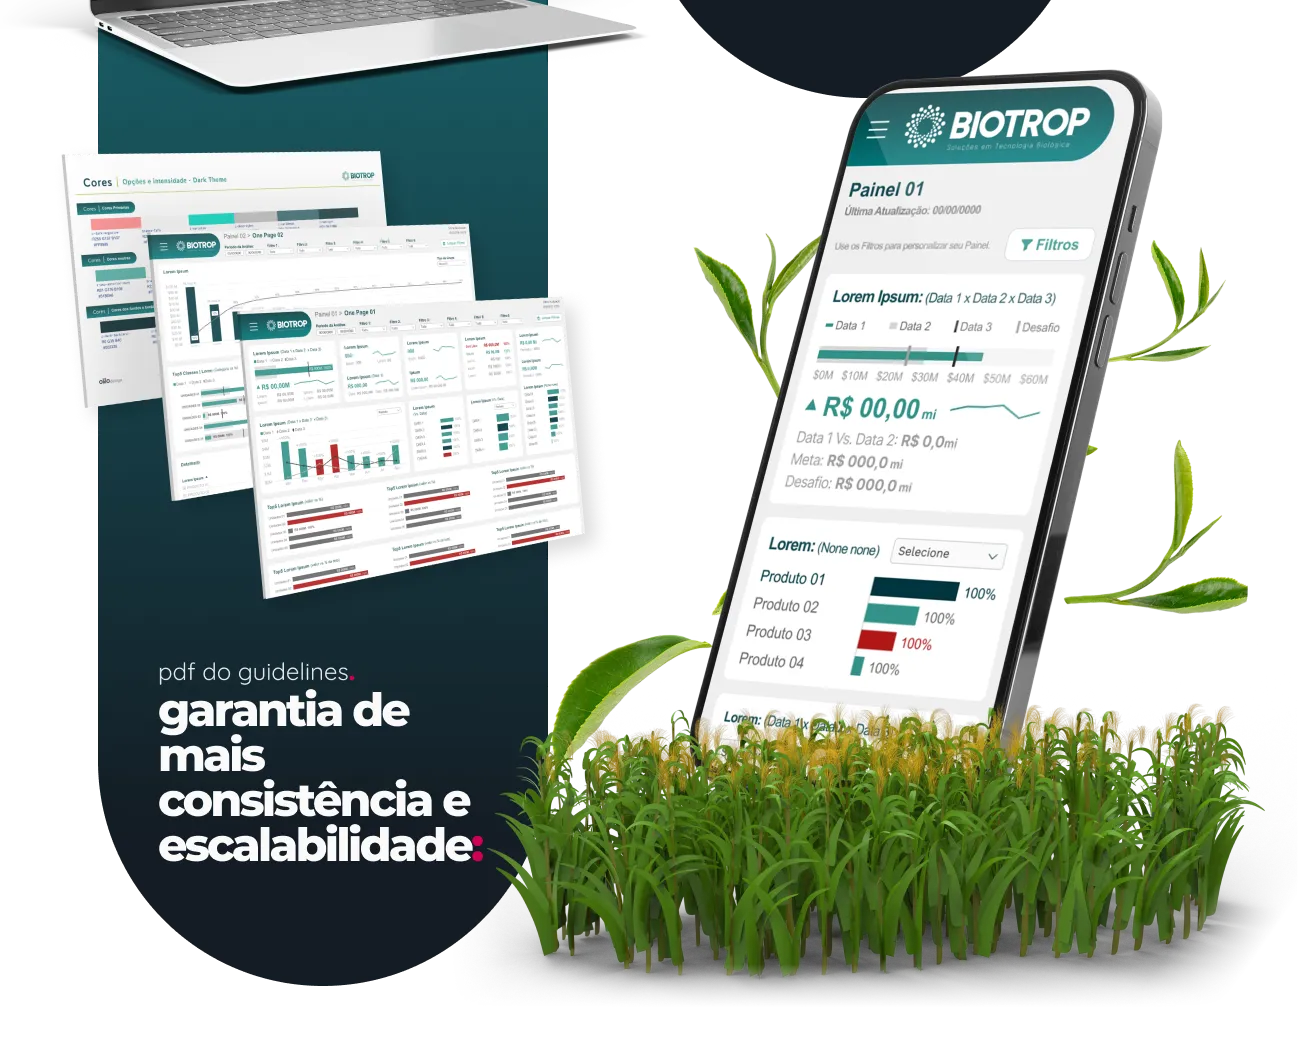
- New Power BI themes.
- Best practices manual for the data team.
- Information Design and UX for Data course for the team.
- Continuity with interviews, prototyping and tracking of results.
the result.
- Directors and managers spent less time looking for information.
- Power BI usage reports showed managers using the screens designed for them instead of exporting to Excel.
- The data team started delivering more efficient solutions after the training.
“The partnership between Biotrop and Olilo Design has been fantastic. We have complete support in every phase of development for delivering dashboards, from the initial phase of mapping users' data needs to the final delivery, applying design, usability and user experience concepts, adding more value to our BI solutions.”
Adan Yoshimoto, Senior Data Analyst, Biotrop