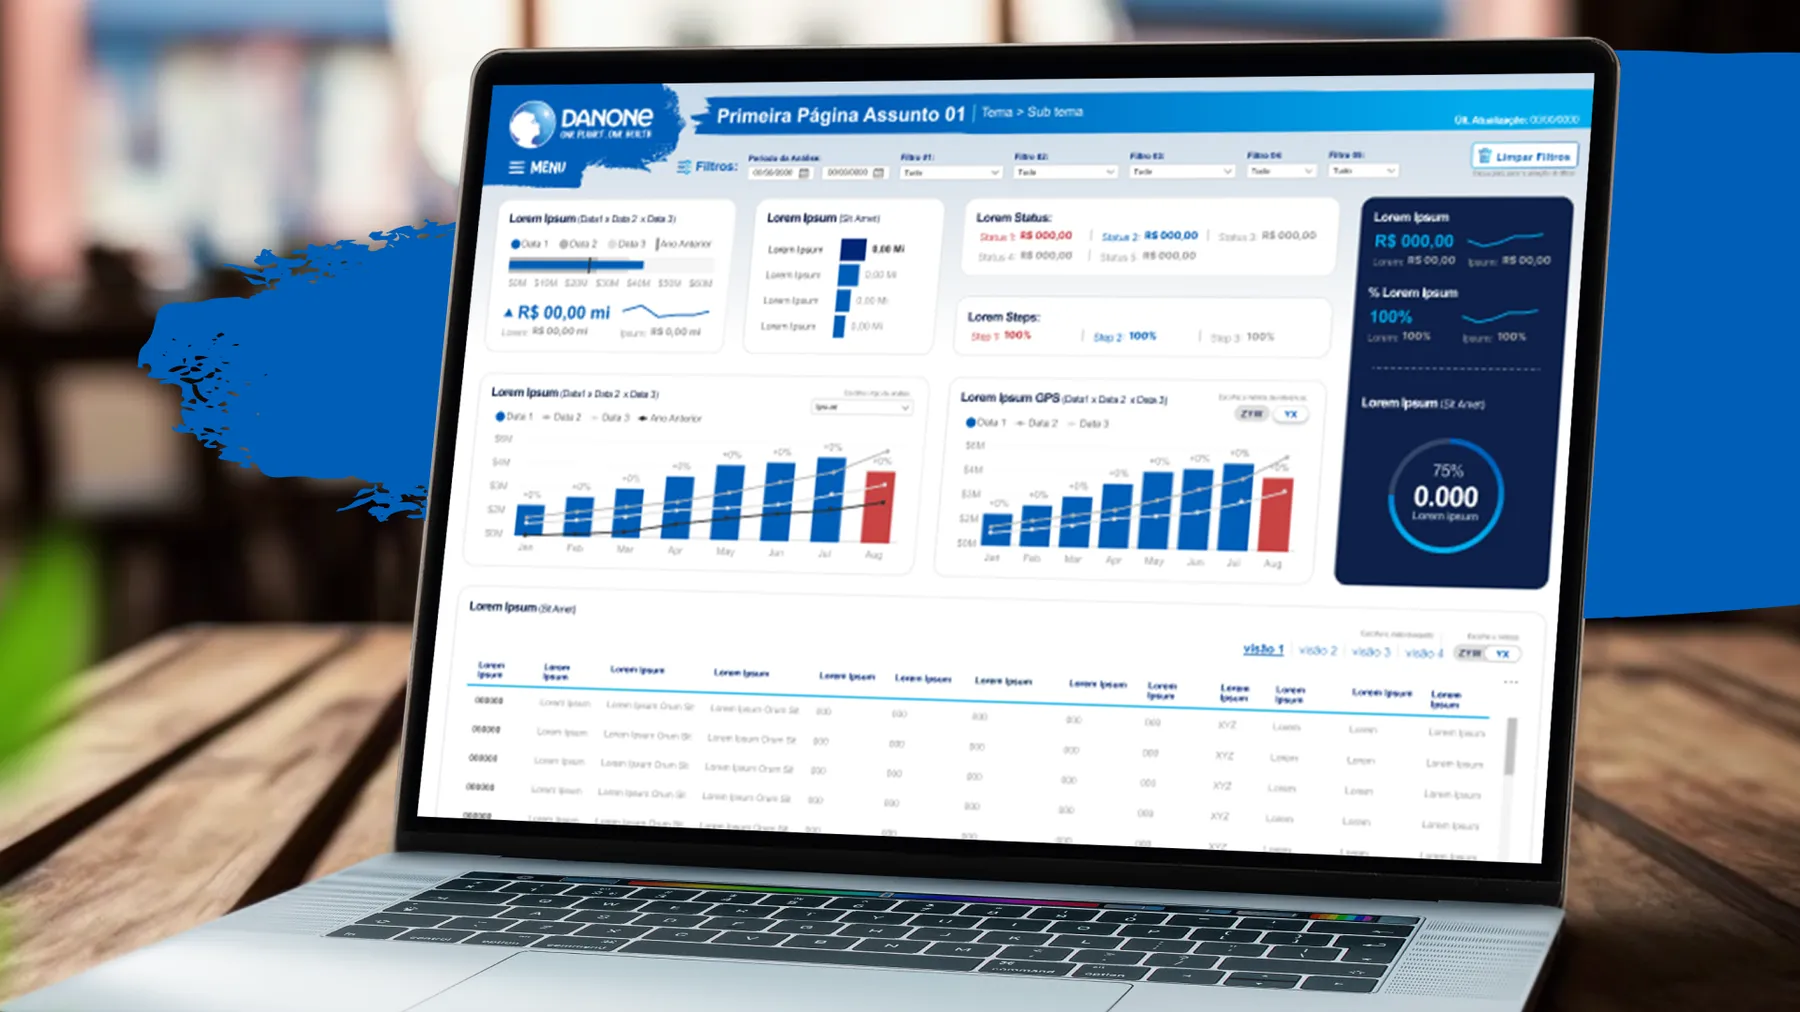
Data is treated as the new oil. The question that remains: is it enough to deploy a BI tool without caring about the experience of the people who will use it? Decisions that move companies are made by people, and the dashboard has to work for them.
the scenario.
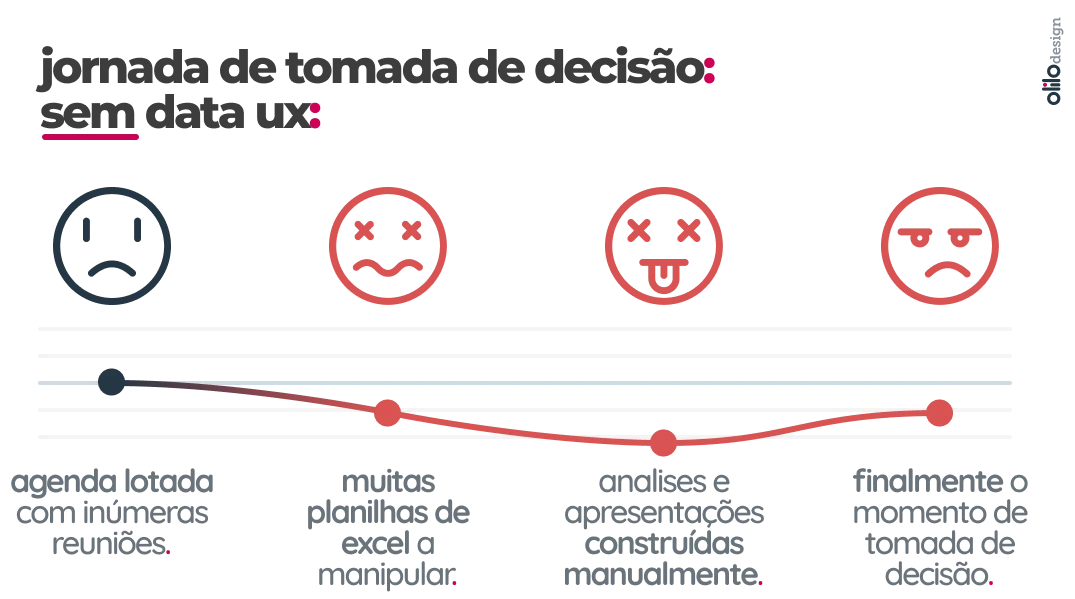
Picture a mid-sized or large company, full of reports and dashboards. Managers and directors get lost in Excel files or export data from the BI to build their own analyses. It seems harmless, but it has hidden costs.
the risks of spreadsheets.
Constantly manipulating data in Excel weakens trust in the information and pulls leaders away from strategic tasks. On top of that:
- errors stay hidden;
- information gets lost;
- consolidated results take a long time to appear;
- productivity drops because of the complexity of the task.
case study: the regional manager.
Think of a regional manager with a sales dashboard by team and by territory. When they need to investigate a problem or prepare a presentation for the board, the dashboard doesn’t answer. It’s only good for exporting data.
the invisible costs.
Suppose a manager with a salary of R$ 30,000 (not counting payroll charges, to keep it simple). Preparation time by type of meeting:
- weekly meeting: almost a full day;
- biweekly: 2 days;
- monthly: 3 days;
- quarterly: 5 days, because of the complexity and the cross-checking with peers.
At a daily cost of about R$ 1,300, that adds up to roughly R$ 103,600 per semester and R$ 207,000 per year. That’s 76 days a year manipulating data instead of deciding. In a company with five to eight regional managers, the bill goes past R$ 1.6 million a year. We have already worked with companies with more than 20 managers.
the solution.
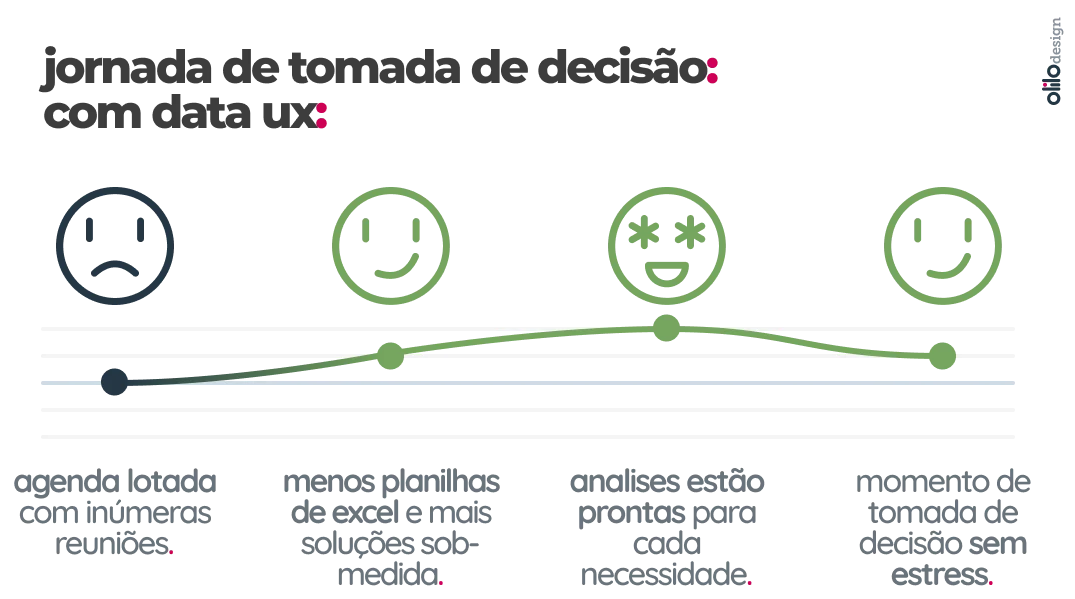
With in-depth interviews, we map these users’ pains and friction points and build reports that answer their questions. If each manager’s decision journey gets 30% shorter, a conservative scenario, the example company saves close to R$ 500,000 a year, and those managers get 30% of their time back for strategic activities.
invest in UX or not?.
With Power BI, Tableau and so many other tools available, the difference between a BI that gets used and a BI that gets ignored is in the design of the experience. Taking care of the UX of your data solutions is no longer optional.
The figures above are an illustrative simulation to show the order of magnitude of the problem.